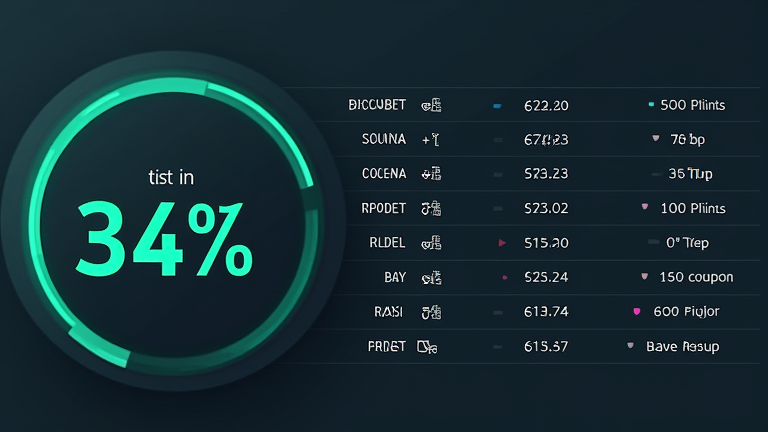
TL;DR: This dashboard is a sophisticated toy, not a production-ready tool, because it relies entirely on fabricated data and static styling. While it demonstrates impressive prompt engineering capabilities, it lacks the dynamic backend logic required for real-world business intelligence applications.
Getting Started
To replicate this project, you need a modern AI coding assistant capable of understanding complex UI frameworks like React or Vue. Begin by defining your core requirement: a visual dashboard that looks professional but functions only with dummy data. This distinction is crucial for setting realistic expectations about the output’s utility.
If you want to dig deeper, check out our guide on Complete Step-by-Step SEO Tutorial for Beginners (2024).
Step-by-Step Instructions
Step 1: Define the Layout Start by describing the general structure in your prompt. Ask the AI to create a three-column layout with a sidebar navigation, a top header, and a main content area. Specify that you want a dark mode theme for a modern aesthetic.
Step 2: Generate Dummy Data Instruct the model to generate a JavaScript object containing fake metrics, such as user growth, revenue, and server uptime. Ensure these values are hardcoded or randomly generated on load, as no API integration is needed for this prototype.

Step 3: Build Components Request specific components for each section, including a bar chart for revenue, a pie chart for user demographics, and a line graph for traffic trends. Ask the AI to use a library like Chart.js or Recharts for visualization.
Step 4: Style and Polish Provide detailed CSS instructions to ensure responsiveness. Ask for smooth transitions on hover states and consistent typography. Review the generated code to ensure that the spacing and alignment match your initial design vision.
Tips for Success
Iterate your prompts. If the chart colors clash, explicitly ask for a specific palette. Always separate your concerns; ask for the logic and the view separately to keep the code clean. Remember, this is a visual proof of concept. Do not deploy this to production without adding real data sources and security checks. The value here lies in the speed of prototyping, not the robustness of the final build.
FAQ
Q: Can I use this dashboard for real business analytics?
A: No, this dashboard uses fake data and lacks backend connectivity, making it unsuitable for actual decision-making.
Q: How long does it take to generate this code?
A: With a capable AI tool, the initial structure and styling can be generated in under five minutes.
Q: Is the code easy to modify later?
A: Yes, if you use clean, component-based architecture, swapping dummy data for real API calls is straightforward.